Data types and roll-ups
Find out how different indicators in a model can be aggregated and rolled up depending on the use case

Rob Markwell
Last Update één jaar geleden
When aggregating data within a model, different indicators require distinct roll-up methods. Blox offers flexibility in defining how indicators are aggregated across time and dimension items.
For example:
- When calculating the Number of Units Sold for all Products, you want to sum the each of the individual Products in the dimension to find the total.
- When calculating the Gross Profit Margin (%) for all Products, you do not want to sum the value of each individual product as this will add to greater than 100%
- When viewing an Annual view of Headcount in the business, it is standard to take the Final value of headcount in the year. Summing each of the months will give you an incorrect value.
This behaviour is controlled in Blox using the Roll-up type property for each indicator. The roll-up type will define how the indicator is aggregated across:
- Time - how will annual or quarterly totals be calculated for the indicator.
- Dimension items - how will totals be calculated when data is input or calculated for each dimension item.
Roll up types
Number
Most indicators which represent numerical values will be of Number type. The aggregation over time and dimensions for a number is:
- Time - Summed across the different time periods to calculate the total
- Dimension items - Summed across each item to calculate the total
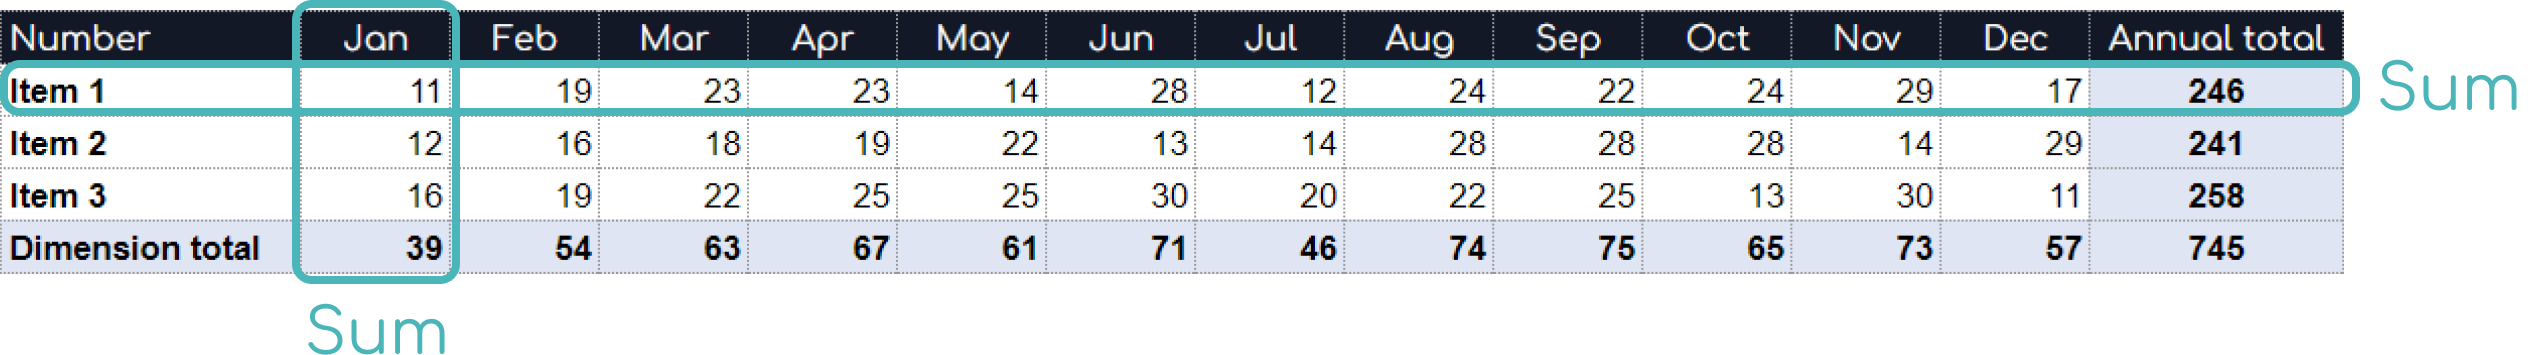
Common indicators with the Number roll up type:
- Revenue generated by the organisation
- Total Employee Costs for the business
- The Number of Units sold of a product for an e-commerce business
Statistic
Some indicators, such as those calculated as percentages or divided values are better represented by averages rather than summed totals. We can use Statistic type for these, which will be aggregated by:
- Time - Averaged (mean) across the different time periods to calculate the total
- Dimension items - Averaged (mean) across each item to calculate the total
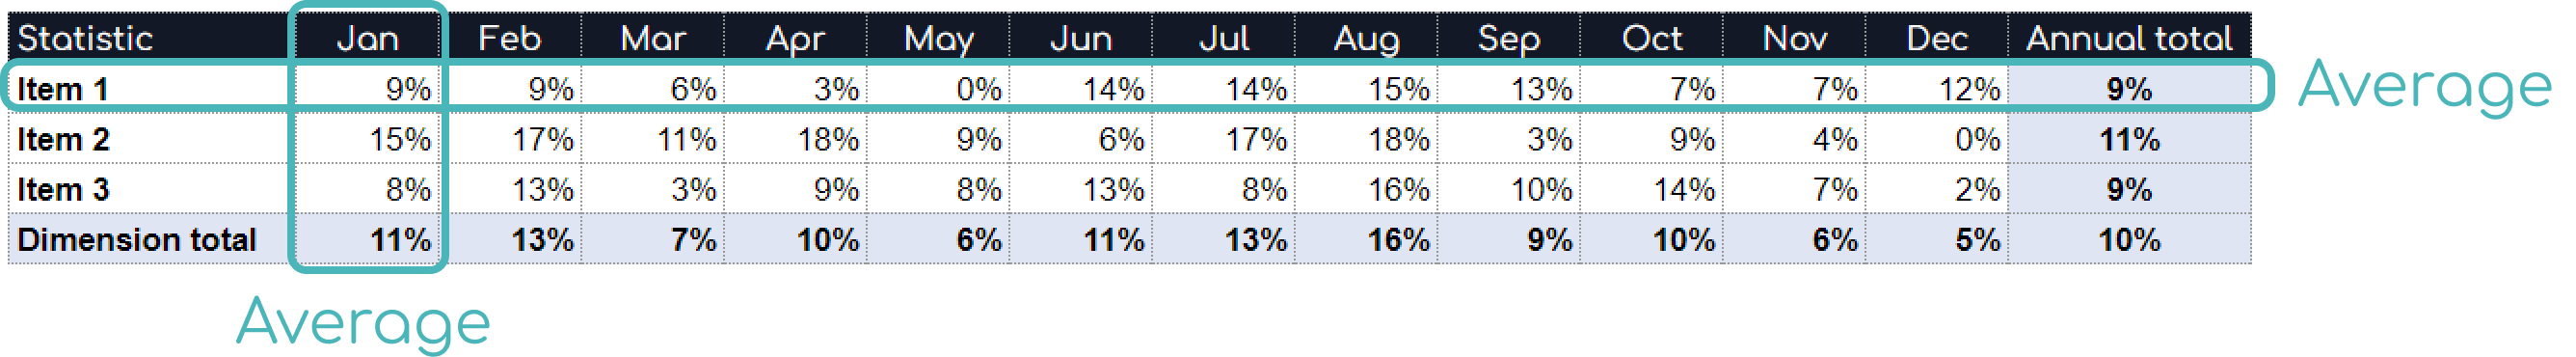
Common indicators with the Statistic roll up type:
- Tax rate
Ratio
When dealing with values that are calculated from other indicators - there are some complex cases where the calculated value of totals may be different to the total of the calculated values. Effectively - the order in which the aggregation occurs can impact the values which.
For these examples we can use the Ratio data type, which will back-calculate totals to ensure consistency across the model.
Common indicators with the Ratio roll up type:
- Price
- Profit margin
Balance
Balance type indicators are indicators which have a value which is relevant for a point in time. As a result we do not want to sum them over time, but instead take the current value at the end of the period being aggregated. Therefore Balance indicators are aggregated by:
- Time - The final value in the time period is taken as the aggregated value
- Dimension items - Summed across each item to calculate the total
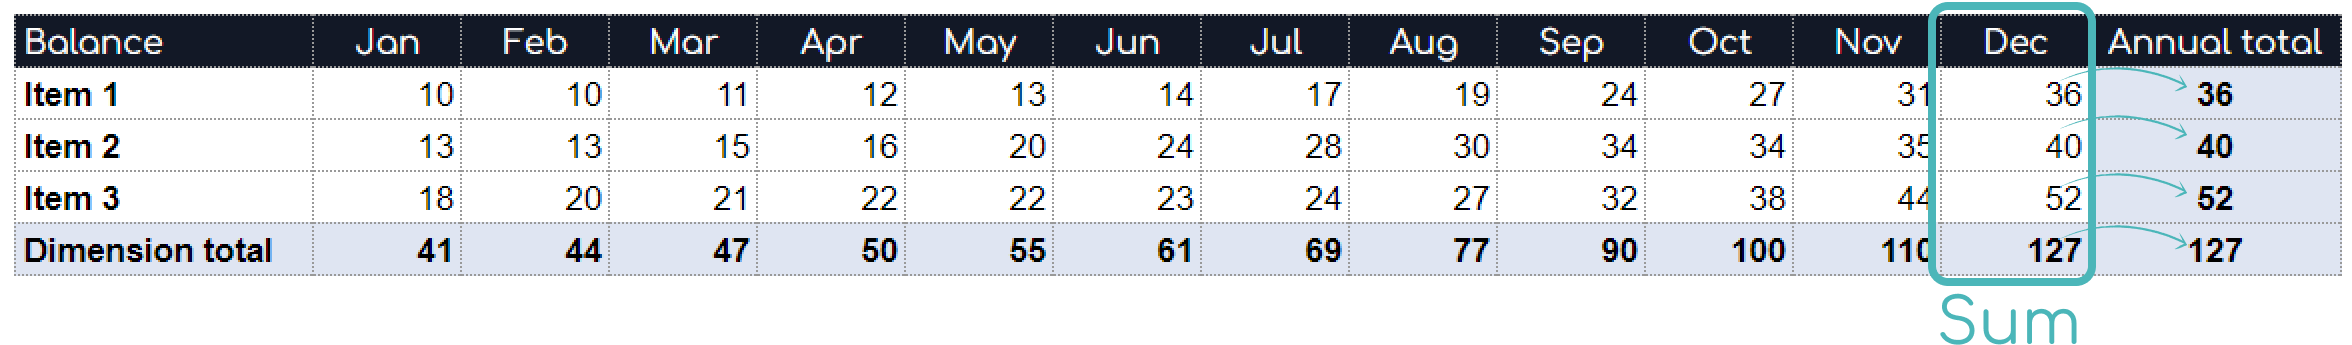
Common indicators with the Balance roll up type:
- Headcount
- Inventory
- Assets on the balance sheet
Opening balance
The Opening Balance works in the same way as the Balance type, however when aggregating over time it will take the first value in the time period. This is key for indicators which roll forward in time, but represent the initial value.
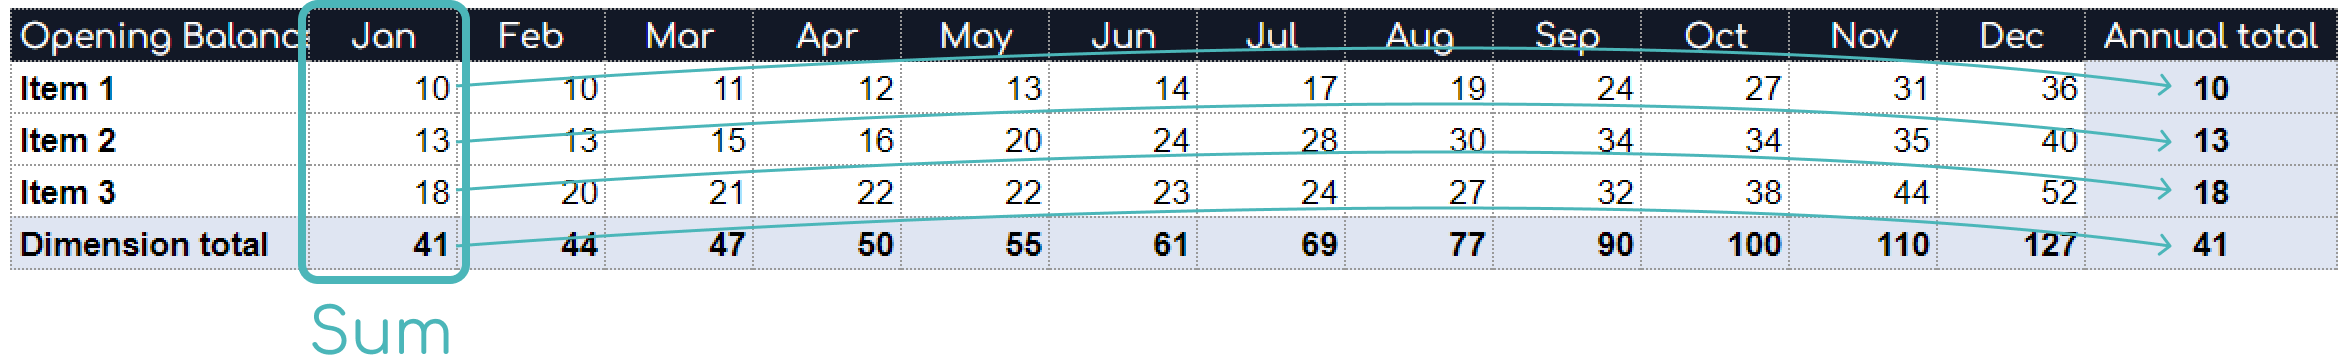
Common indicators with the Opening Balance roll up type:
- Opening cash balance
- Starting headcount
Summary
| Roll up type | Time roll up | Dimension roll up |
|---|---|---|
| Number | Sum | Sum |
| Statistic | Average | Average |
| Ratio | Average | Back-calculated |
| Balance | Final value | Sum |
| Opening balance | Start value | Sum |